Gallery
plasmocyte images: illustrations and micrographs. All credits and licenses listed.
Micrographs
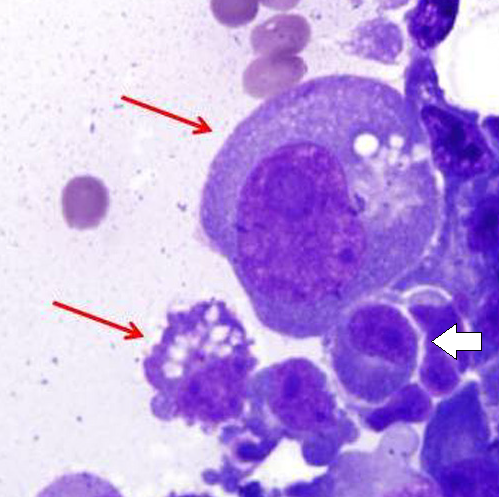
Histopathology of Mott cells with Russell bodies (red arrows) compared to an almost normal plasma cell (white arrow, prominent nucleolus). Primary malignant myelomatous pleural effusion. H&E.
Mangla A, Agarwal N, Kim GJ, Catchatourian R. Clin Case Rep. 2016;4(8):803-6. DOI:10.1002/ccr3.634 · CC BY 4.0 · source
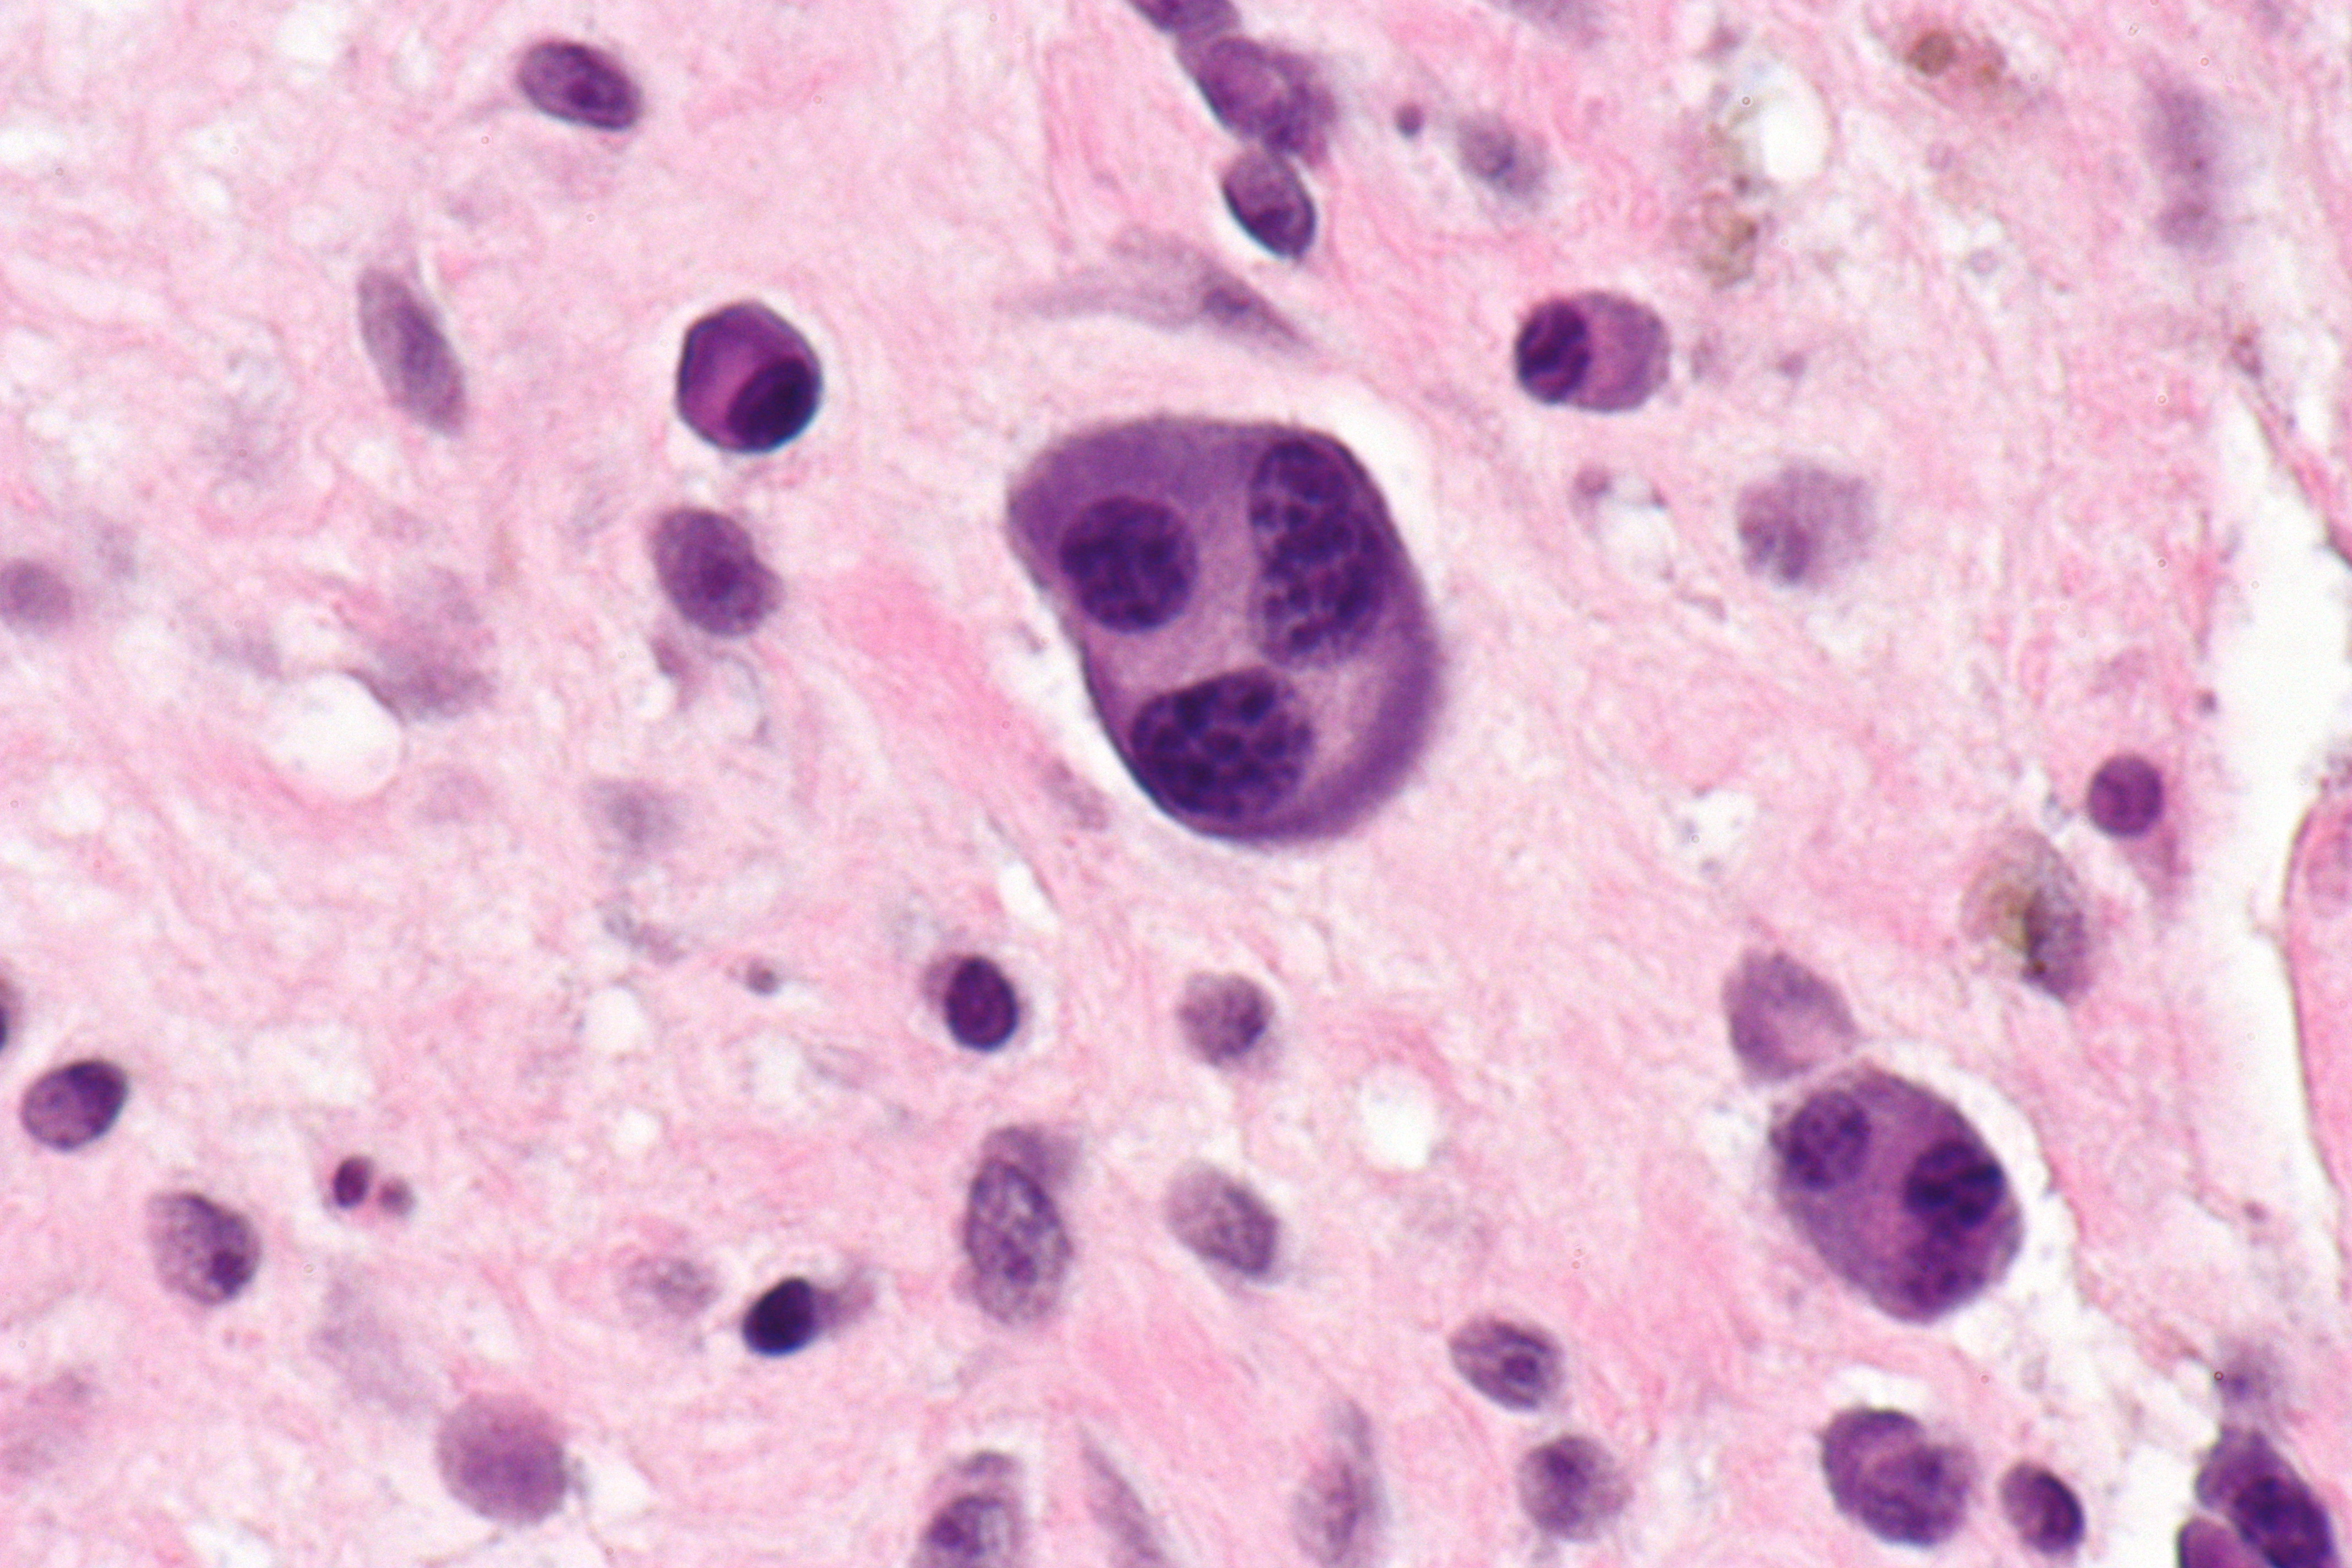
Multinucleated plasma cell, H&E stain, extremely high magnification. An atypical form seen in some myeloma cases.
Nephron, Wikimedia Commons · CC BY-SA 3.0 · source
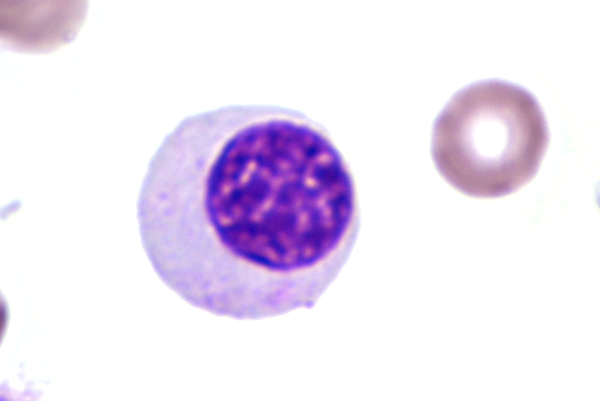
Plasma cell (plasmocyte) micrograph showing eccentric nucleus and basophilic cytoplasm.
Guy Waterval, Wikimedia Commons · Apache License 2.0 · source
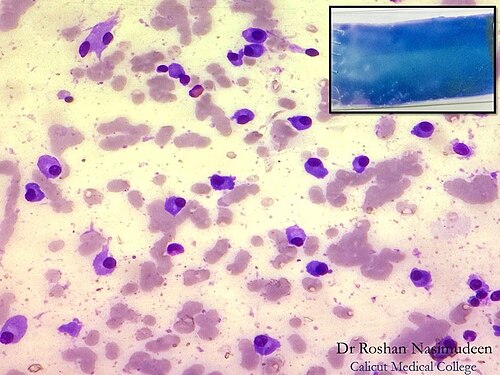
A case of Multiple myeloma and the bone marrow smear shows plasma cells with eccentric nucleus, bluish cytoplasm and a pale Golgi zone. Nuclear details cannot be appreciated at this power. As for the glass slide, naked eye examination itself shows a blue staining. This is due to the romanowsky stain interacting with the fixed paraprotein on the blood/marrow film.
Dr. Roshan Nasimudeen · CC BY-SA 3.0 · source
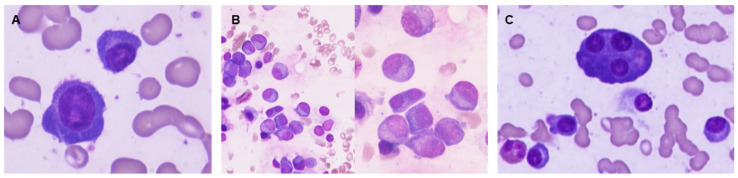
Examples of bone marrow samples colored by May-Grünwald-Giemsa, 1000× magnification. Plasma cell with morphologic immaturity: high nucleus/cytoplasm ratio and dispersed chromatin (A). Binucleated plasma cell and several plasma cells (PC) with dispersed chromatin (B). Bone marrow showing mature PC and a multinucleated plasma cell (C).
Pires, Barreto, Caetano et al. J Clin Med. 2025. Figure 5. · CC BY 4.0 · source
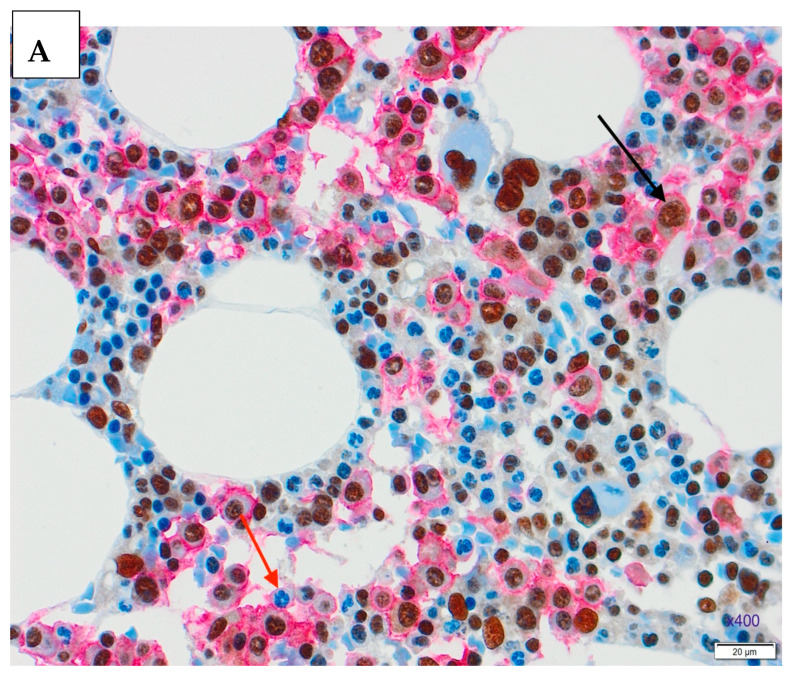
Double staining in the trephine biopsy, CD138 staining with Dako REAL Detection System Alkaline Phosphatase kit K5005, red chromogenic presentation, MDM2 staining with DAB chromogen in brown, x400. ( A ). Newly diagnosed MM trephine biopsy, positive nuclear staining (black arrow) and negative nuclear staining (red arrow). ( B ). Trephine biopsy after the therapy, positive nuclear staining (black arrow) and negative nuclear staining (red arrow).
Stanic Damic, Grubesic, Peric et al 2025, Medicina · CC BY 4.0 · source
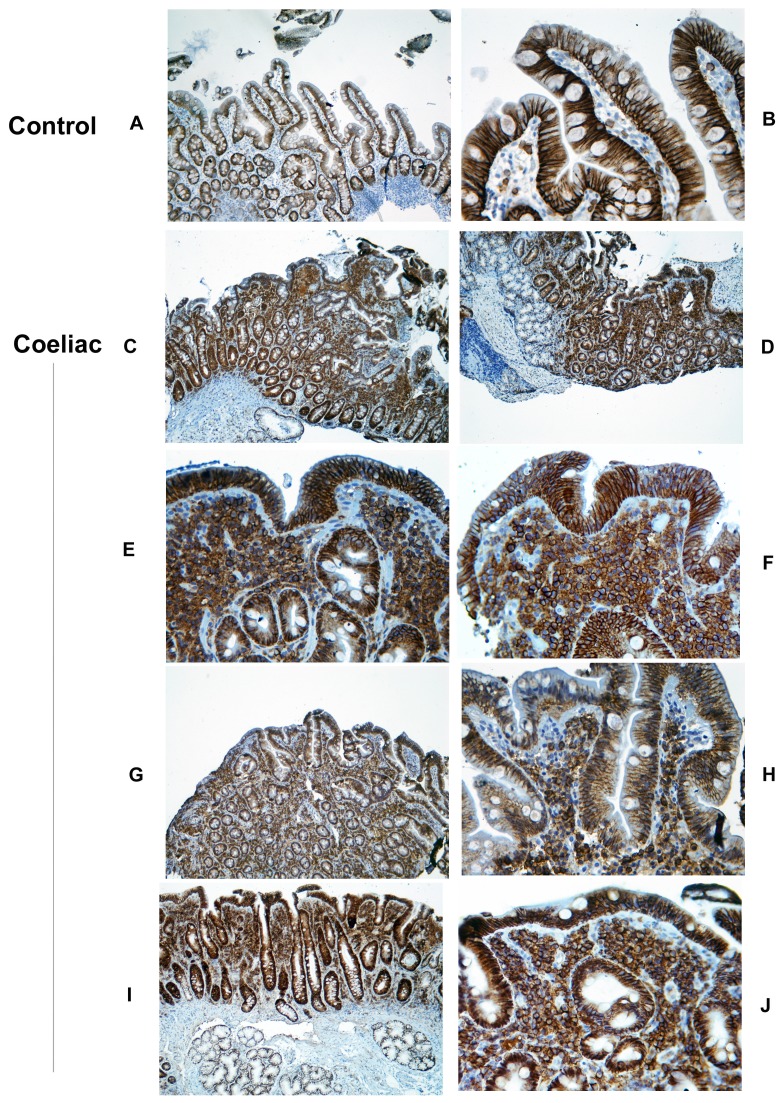
Syndecan-1 (CD138) expression in normal and coeliac mucosa using monoclonal MCA2459GA. A. Expression within normal intestine, showing syndecan-1 localises predominantly to the basolateral epithelial surface (original magnification x10). B. Higher power view (x40) of normal duodenum, showing similar epithelial localisation plus the presence of scattered syndecan-1+ plasma cells within the lamina propria. C,D. Low power view (x10) of 2 cases of coeliac disease, showing retention of epithelial staining similar to controls, plus additionally a dense confluent expression within the upper lamina propria. E,F. Higher power view (x40) of the subepithelial region in these cases. The lamina propria aggregates consist of cells with dense membrane staining (plasma cells), cells with recognisable nuclei and punctate cytoplasmic staining and scattered syndecan-1+ debris (shed ectodomains)
Salvestrini, Lucas, Lionetti et al 2014, PLoS ONE · CC BY 4.0 · source
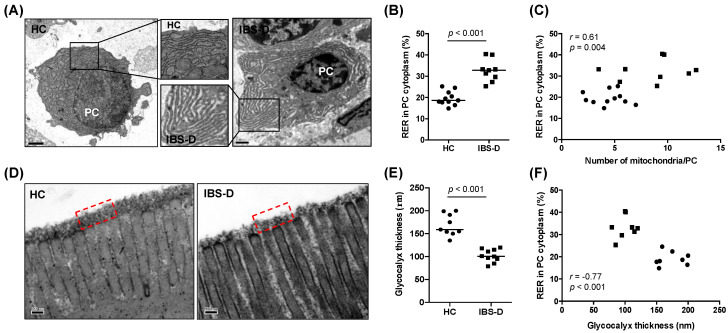
Plasma cell ultrastructure and glycocalyx thickness in the jejunal mucosa of HC subjects and IBS-D patients. (A) Representative transmission electron microscopy images of plasma cells from HC (left panel) and IBS-D (right panel) groups. Inserts show the morphology of the RER in each group. Bar represents 1 µm. (B) Quantification of the percentage of RER area in the cytoplasm (%RER) in plasma cells in HC (n = 11) and IBS-D (n = 9) groups. (C) Correlation assessment between the %RER and the number of mitochondria per plasma cell (pooled participants, n = 20). (D) Representative transmission electron microscopy images of the glycocalyx overlying the microvilli from HC (left panel) and IBS-D (right panel) groups.
Pardo-Camacho, Ganda Mall, Martinez et al 2022, Cells · CC BY 4.0 · source

骨髓涂片胞质轻链免疫荧光结合FISH典型荧光信号(×100)A 1q21扩增(信号模式:3R2G);B 1p32缺失(信号模式:2R1G);C p53缺失(信号模式:1R1G);D IGH易位(信号模式:1R1G1F);E IgH/FGFR3融合基因(信号模式:1R1G2F)
Shi, Yang, Guo et al 2024, Chinese Journal of Hematology · CC BY 3.0 · source
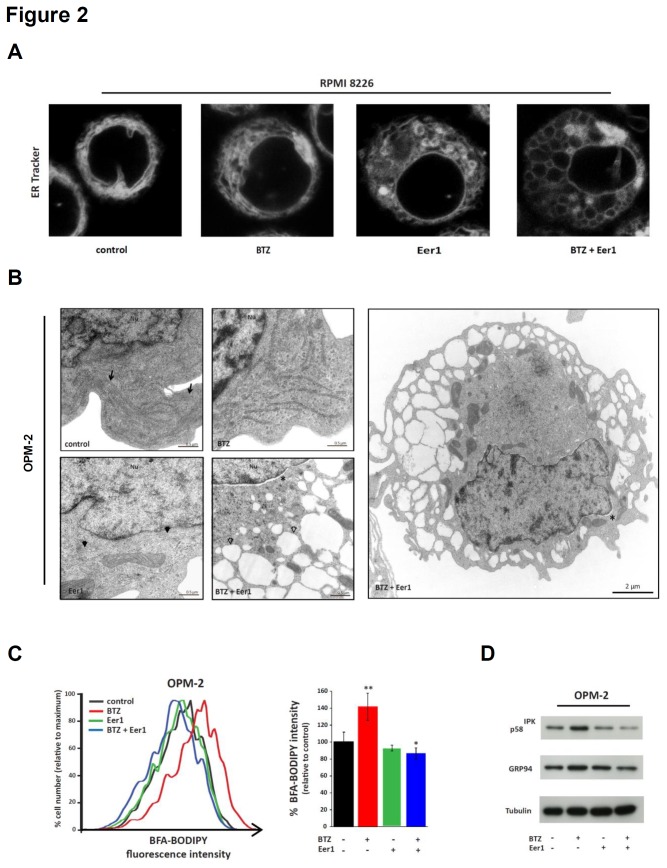
Combined inhibition of p97 and the proteasome dramatically affects ER configuration. ( A ) RPMI 8226 myeloma cells were stained with ER Tracker Blue-White DPX following treatment for 24h with bortezomib (BTZ; 5nM), Eer1 (5µM), or both. Representative confocal microscopic images show minor ER alterations after BTZ treatment, transformation of tubule-lamellar into globular ER structures after treatment with Eer1, and widespread ER vacuolisation after dual treatment. ( B ) Representative electron microscopic images of OPM-2 cells after treatment with BTZ (5nM), Eer1 (5µM), or BTZ and Eer1, for 24h. Arrows indicate classical ER in control cells, black arrowheads indicate moderately dilated and disrupted ER in Eer1-treated cells, and open arrowheads indicate vacuolised ER with reduced ribosomes on the cytosolic ER surface. Another cell treated with Eer1 and BTZ is shown at lower magnification (right panel). Areas of dilated perinuclear space are indicated by asterisks. Nu, nucleus.
Auner, Moody, Ward et al 2013, PLoS ONE · CC BY, version not stated by the source · source
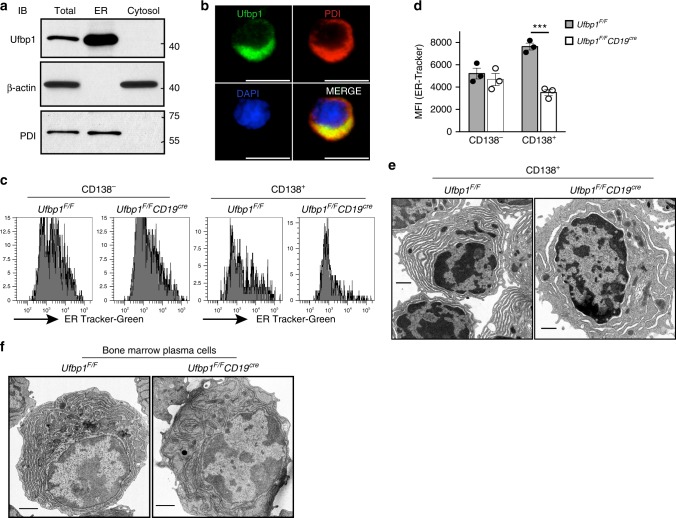
Ufbp1 is required for endoplasmic reticulum (ER) expansion in antibody-secreting cells. e Transmission electron microscope images of CD138 + cells sorted from LPS-stimulated B cell cultures from Ufbp1 F/F and Ufbp1 F/F CD19 cre mice. Scale bars are 1 µm. f Transmission electron microscope images of bone marrow plasma cells isolated from mice of indicated genotype. Scale bars are 1 µm.
Zhu, Bhatt, Sivaprakasam et al 2019, Nature Communications · CC BY 4.0 · source
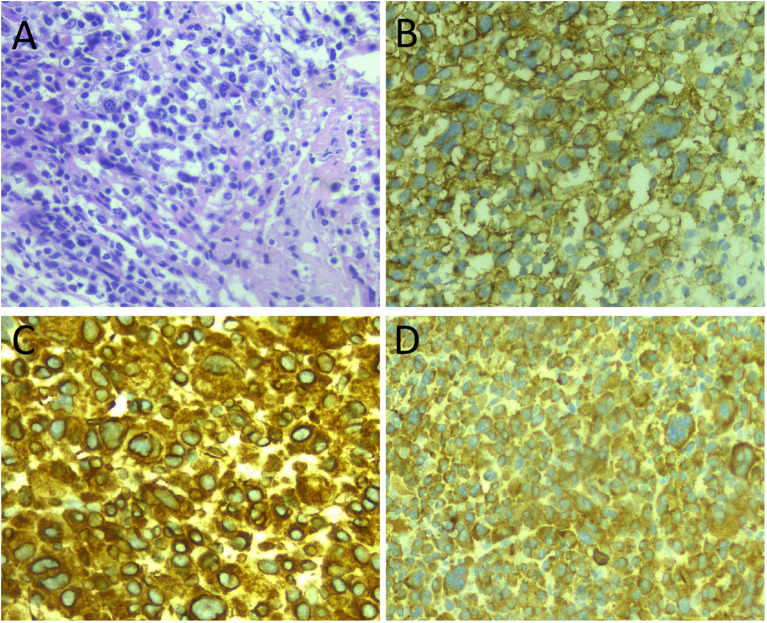
Hu, Li, Hu et al 2026, Frontiers in Oncology · CC BY 4.0 · source
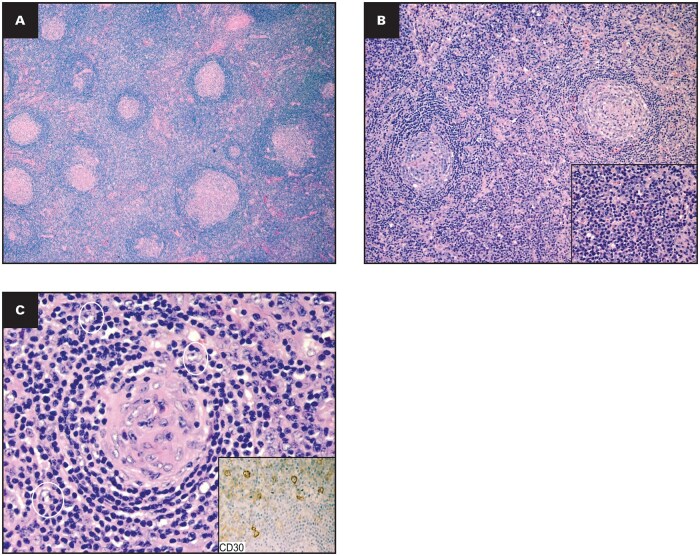
Histopathologic features of plasma cell/plasmacytic idiopathic multicentric Castleman disease. (A) Hyperplastic follicles HE stain in 4x magnification; (B) prominent interfollicular plasmacytosis; HE stain in 10x magnification (inset: HE stain higher magnification- 40x); (C) presence of plasmacytoid immunoblasts 'white circles' HE in 40x magnification (inset: Immunostain CD30-positive immunoblasts in 40x magnification). HE, hematoxylin and eosin.
Alapat, Etebari, Van Rhee et al 2026, American Journal of Clinical Pathology · CC BY 4.0 · source
Illustrations
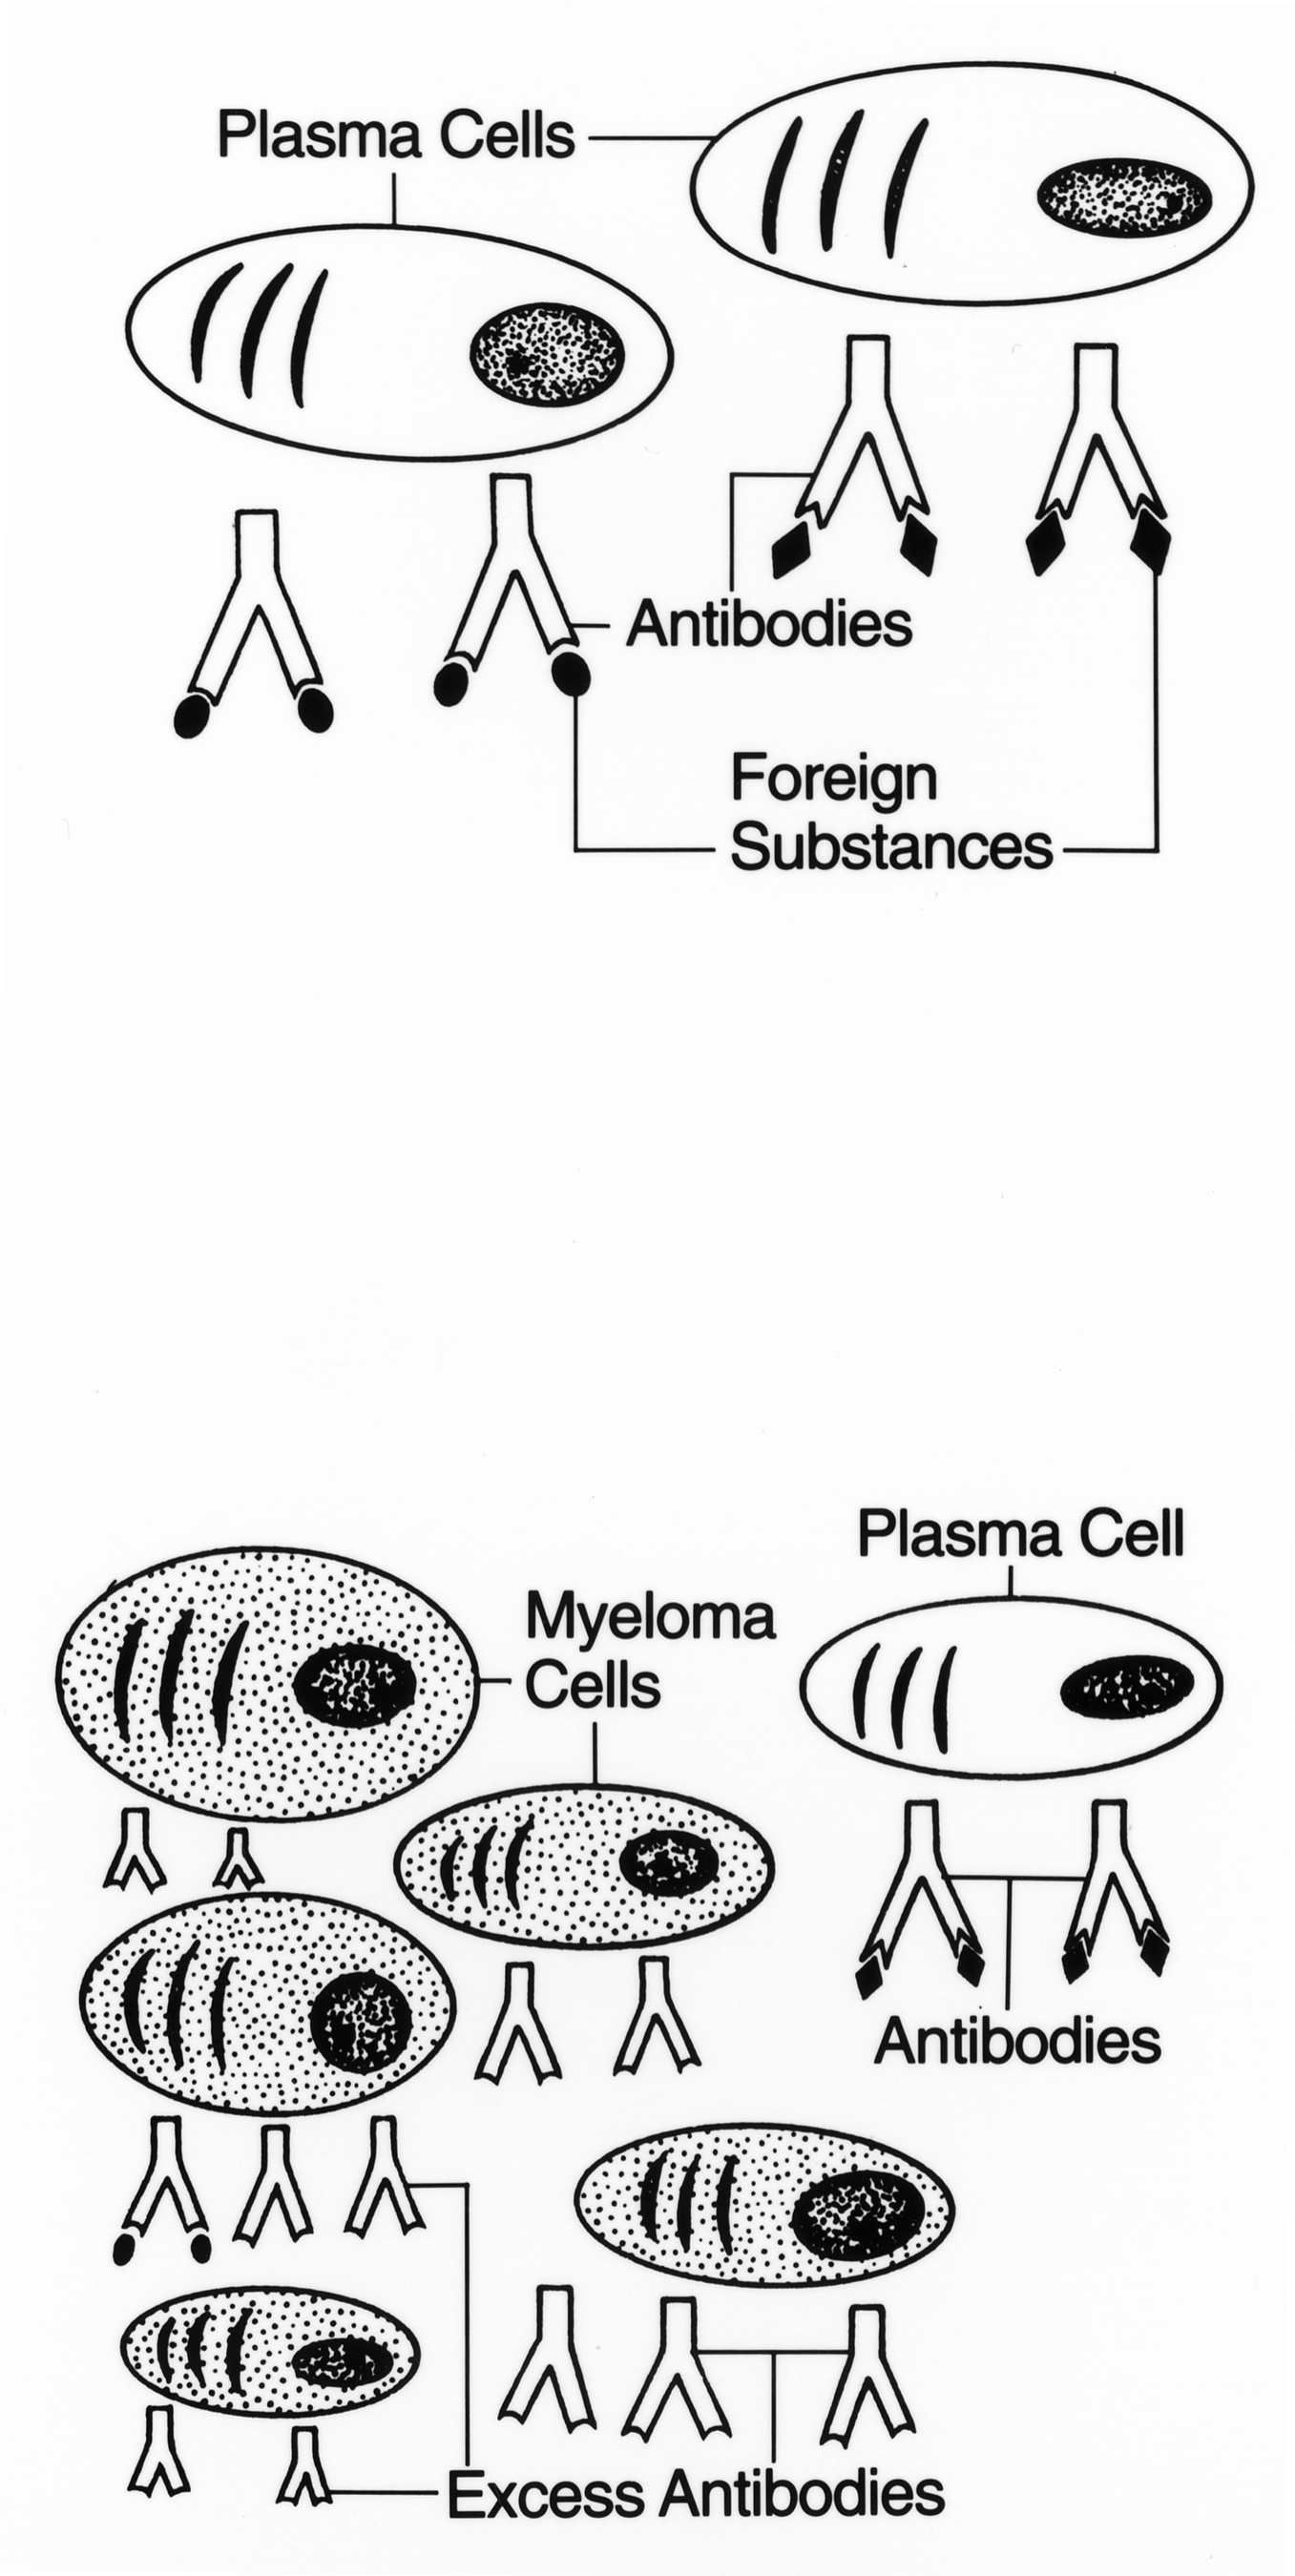
Normal plasma cells producing antibodies (top) versus excess myeloma plasma cells producing unneeded antibodies (bottom). Medical illustration, NCI 1995.
National Cancer Institute, National Institutes of Health. Image ID 2718. · public domain · source
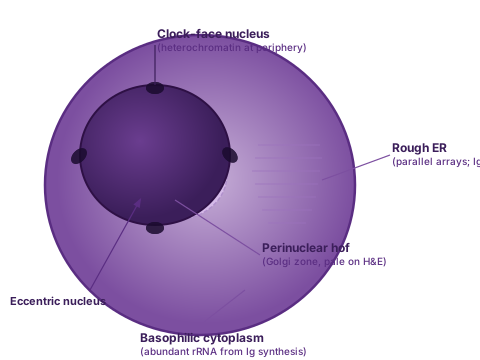
Mature plasma cell: clock-face (cartwheel) nucleus, perinuclear hof (Golgi zone), and expanded basophilic cytoplasm packed with rough endoplasmic reticulum. Labeled illustration.
plasmo.site · CC0 · source
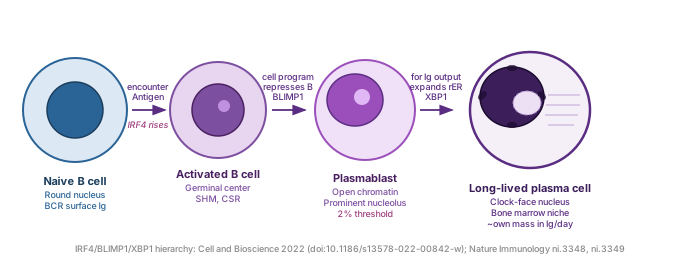
B cell to plasma cell terminal differentiation: naive B cell, germinal center activation, plasmablast, and long-lived plasma cell. Key transcription factors IRF4, BLIMP1, and XBP1 labeled at each transition.
plasmo.site · CC0 · source